Our interactive site needs JavaScript enabled. Here's where to go in the meantime.
How leadership teams turn connected systems into faster, better calls.
Company
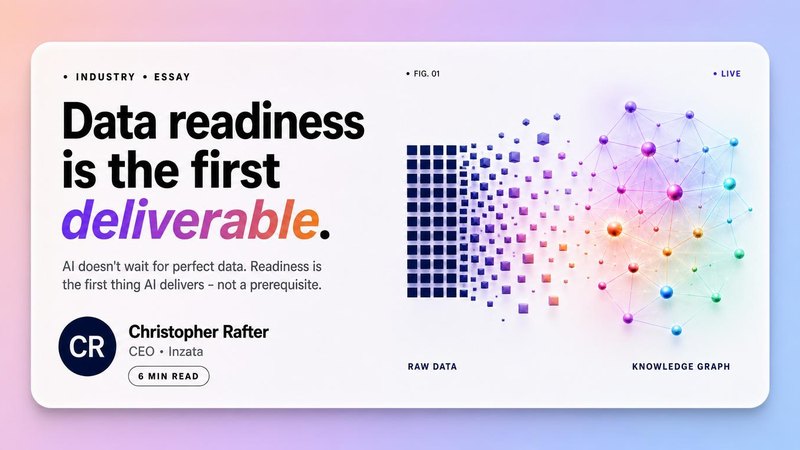
A CIO's playbook for jump-starting AI in a single quarter. Stop treating data readiness as the prerequisite. Make it the first thing AI delivers, and turn it into a compounding asset.
Christopher Rafter · Jul 15, 2026
SaaS companies use SIGNLD to connect Stripe HubSpot Salesforce and Mixpanel and get plain-English answers on MRR churn CAC and NRR - all traceable.
Retail operators use SIGNLD to connect Shopify, Square, and QuickBooks and get traceable answers on inventory turnover, GMROI, and sell-through.
Distribution companies use SIGNLD to connect QuickBooks, Fishbowl, and ShipStation and get traceable answers on fill rate, on-time delivery.
QuickBooks reports only show what's in QuickBooks. If your business runs on 10+ systems, you're making decisions on a fraction of the picture.
Spreadsheets break when your data lives across 15 systems. Manual reconciliation, version chaos, and no cross-system joins mean you're deciding.
Learn how manufacturers use SIGNLD to connect NetSuite, Fishbowl, and MES data and get traceable answers on OEE, throughput, and labor efficiency.
Learn how dental practices use Decision Intelligence to track days in AR, collection rate, and production by provider across Dentrix and Eaglesoft.
See how CPA firms track staff utilization rate and billable hours by team member using Decision Intelligence connected to Practice CS and payroll systems.
FieldEdge tracks your dispatches. QuickBooks tracks your invoices. But neither tells you which jobs and technicians are actually profitable.
Dentrix and QuickBooks show you what happened. SIGNLD connects them, maps the relationships, and answers your real questions in plain English - no.
Practice CS and QuickBooks show hours logged and invoices sent. SIGNLD connects them, maps client relationships, and answers your realization.
See how field service contractors use Decision Intelligence to track job costing, technician margins, and parts cost across ServiceTitan, Jobber.
SIGNLD is a decision intelligence platform built for small businesses. Connect your systems, ask questions in plain English, get sourced answers.
A knowledge graph connects your business data across every system and maps how it all relates. Learn how SIGNLD uses a Knowledge Graph to answer.
Morphic SaaS adapts to your business data instead of requiring you to adapt to it. Learn how SIGNLD's morphic approach delivers answers specific.
Healthcare practices use SIGNLD to connect EHR systems, billing, and QuickBooks and get plain-English answers on collection rate, days in AR.
Professional services firms use SIGNLD's Knowledge Graph to connect Harvest, Toggl, HubSpot, and QuickBooks and get traceable answers.
Practice CS and QuickBooks track hours and invoices separately. SIGNLD connects them, maps client and engagement relationships, and answers your.
Dentrix reports show what's inside Dentrix. SIGNLD connects Dentrix to QuickBooks, payroll, and scheduling for cross-system Decision Intelligence.
Tableau and Power BI show what happened. They can't explain why, predict what's next, or answer questions that cross system boundaries. SIGNLD.
Most AI tools analyze isolated datasets. SIGNLD reads your entire business - connecting every system into a Knowledge Graph and answering.
CEOs need cross-functional answers - which business lines are growing, where to allocate resources, what's driving revenue mix. SIGNLD delivers.
FieldEdge reports show dispatch and invoicing inside FieldEdge. SIGNLD connects FieldEdge to QuickBooks and payroll for full job cost and margin.
ServiceTitan manages field operations. QuickBooks holds the financials. SIGNLD connects both for true job profitability, margin by trade.